
Price is what you pay, value is what you get
A central investing tenet is that intrinsic value is the present expected value of future free cash flows to shareholders. So, the distinction that investors make between value and growth investing is not always meaningful. Value, after all, must consider how growth, risk, reinvestment, and return on capital might affect future free cash flows.
This has important consequences as well for the PE, PEG and related ratios. While multiples are useful shorthand, they’re easy to misuse and overuse. The common trap, for example, is in classifying the underperformers as cheap and the outperformers as expensive. To manage this risk in ourselves, we reviewed several articles on the PE ratio. This post will share our lessons learned, using the Gordon Growth Model to tie a few ideas together.
“Long ago, Ben Graham taught me that “Price is what you pay; value is what you get.” Whether we’re talking about socks or stocks, I like buying quality merchandise when it is marked down.”
Warren Buffett, Berkshire Hathaway
The Gordon Growth Model revisited
To begin, let’s revisit our understanding of discounted cash flow (DCF) analysis. We’ll use a simplified version of this, known also as the Gordon Growth Model:
P = D / (r – g)
This expression relates fair value (P) to the distributable cash flows (D), cost of equity capital (r), and sustainable growth rate (g). (D) reflects excess cash flows (e.g., dividends and buybacks) that are not needed for reinvestment in maintenance and growth. We can also think of the cost of equity capital as our opportunity cost of investing in similar assets.
Growth rate (g) reflects the sustainable rate of growth in perpetuity. This parameter shouldn’t exceed the cost of capital. More stringently, as Aswath Damodaran notes in Narrative and Numbers, the sustainable growth rate of a company cannot exceed the long-run growth rate of the macroeconomy either. It would otherwise become the economy itself!
The cornerstone of value creation
In their User’s Manual on the P/E ratio, Epoch Partners’ William Priest and Steven Bleiberg observe that investors focus too much on the denominator of the Gordon Growth Model (r and g) and too little on the numerator (D). This bias for growth may lead investors to neglect broader drivers of shareholder value. Bruce Greenwald makes a similar observation in Value Investing: From Graham to Buffett and Beyond, prompting readers to recognise the relationship between return on capital (ROIC), reinvestment rate (IR), growth rate (g) and earnings (E):
g = IR x ROIC
D = (1 – IR) x E
Intuitively, the company’s growth rate (g) depends on its rate of reinvestment (IR) and the returns it can generate on that investment (ROIC). The first expression tells us that high ROIC companies can achieve the same rate of growth (g) as low ROIC companies with a lower reinvestment rate (IR).
Similarly, the earnings a company has leftover to distribute to its owners depends on this rate of reinvestment. The second expression tells us that if both companies produce similar earnings (E), then the high ROIC company has more cash leftover for redistribution (D). This relationship, as Tim Koller wrote in Value: The Four Cornerstones of Finance, is a central tenet of value creation.
We can reformulate the PE ratio in a more explicit manner:
P = D / (r – g)
P = (1 – IR) x E / (r – g)
P/E = (1 – g / ROIC) / (r – g)
P/E = (ROIC – g) / [(r – g) x ROIC)]
Note
We’ve been a little loose with definitions so far. Since D is distributable cash flows, and IR is the reinvestment rate, then earnings (E), in this context, is more akin to free cash flow. Note also that we are assuming 100% equity financing. That is, there is no role for leverage (a little more on this later). While these simplifications are okay for this exercise, you have to be careful with your choices for E, ROIC, g and IR in practice. Adjustments for cash holdings and debt are often necessary, and historical accounting ratios can differ materially from future economic reality. Good judgement is paramount.
PE ratio, growth, ROIC and implied value
The reformulation above suggests that two companies with identical growth rates can command different PE multiples if their ROICs are different. The rationale is intuitive: Companies have to reinvest capital to grow future free cash flows. But the company that earns a higher ROIC can distribute more cash while growing at comparable rates. This, of course, is more valuable to the investor.
As the eloquent Charlie Munger put it:
“There are two kinds of businesses: The first earns 12%, and you can take it out at the end of the year. The second earns 12%, but all the excess cash must be reinvested—there’s never any cash. It reminds me of the guy who looks at all of his equipment and says, ‘There’s all of my profit.’ We hate that kind of business.”
Charlie Munger, Berkshire Hathaway
The growth and value relation
The savvy investor will remember that free cash flow, ROIC and growth are not independent factors. The ‘value’ investor that focuses only on the company’s PE ratio is likely to neglect undervalued businesses with superior ROIC and growth prospects. Likewise, the ‘growth’ investor that focuses too much on the growth rate is at risk of overpaying for vivid narratives.
“Many strategists now claim that ‘value looks cheap compared to growth.’ Though I understand what they mean, and even agree with it, the phrase bothers me… “value” and “growth” aren’t opposites. When we say we are value investors, … it simply means that we estimate what each business is worth based on its own unique fundamentals and buy only those that are priced well below that estimate.”
Bill Nygren, Oakmark Funds
Valuing ROIC and growth
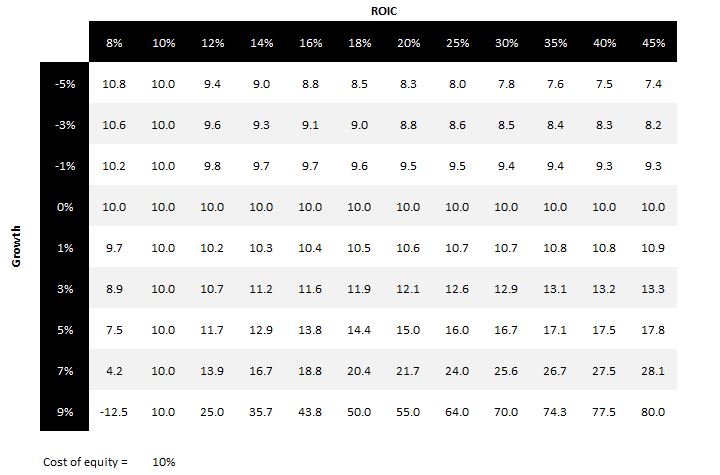
Under the assumptions of the Gordon Growth Model, there is a ‘fair’ PE multiple for companies of different growth rates and ROIC (assuming a cost of capital at 10%). As the table below suggests, growth destroys value when the company’s ROIC is below its cost of capital. It’s better for these companies to return shareholder capital instead, given the opportunity cost. As Michael Mauboussin noted, growth only creates value when the company can generate a return in excess of its cost of capital.
Implied PE ratio by ROIC and growth
PEG multiple
As Bleiberg & Priest note, investors should take care with their use of PEG multiples as well. Like the PE ratio, the PEG ratio doesn’t account properly for ROIC or growth itself. For example, the PEG multiple favours companies that are growing faster, even when the company’s ROIC is equal to its cost of capital (in which growth neither creates nor destroys value). The authors suggest that the PEG ratio, like the PE ratio, tells us little about the relative valuation of companies by its lonesome.
Mean reversion
Some investors will argue that a stock is cheap because it’s trading at multiples below its historical average. Again, Bleiberg & Priest highlight here the implicit assumption that they’ve made: that nothing fundamental about the company or its industry has changed, only its price. Historical multiples, by themselves, tell us nothing about the direction of industry. We shouldn’t expect mean reversion without proper reasoning. Context matters.
Cash and leverage
The commentary and results above ignore the impact of cash holdings and leverage on multiples. Both factors can affect the level of distributable future free cash flows. Aswath Damodaran describes how leverage increases both the expected returns and riskiness to shareholders. On one hand, prudent debt financing may lower the cost of capital, and improve cash flows through tax deductions on debt. But too much debt can balloon a company’s borrowing rate, interest expenses and risk of default. As Damodaran notes, “a low PE ratio can be indicative of cheapness, but it can also be the result of high debt ratios”.
Large cash holdings, by contrast, tend to put upward pressures on the company’s PE multiple. This is intuitive when we think about the future free cash that shareholders might get to claim. Hence, when analysing the PE multiple of companies with large cash holdings, Damodaran recommends we adjust for the cash effect on market capitalisation (i.e., subtracting cash) and earnings (e.g., subtracting interest on cash). It’s important also to consider how debt levels and cash holdings have changed when comparing PE multiples across time.
From Greenblatt to Buffett
The drivers that underpin the PE multiple support the approaches that many great investors follow. For example, Joel Greenblatt and his ‘magic formula’ filters for high ROIC companies that trade at high earning yields. To him, this is both a simultaneous measure of quality and cheapness. Similarly, investors like Warren Buffett and Peter Lynch prefer companies that earn a high return on equity, use little debt, and trade at affordable multiples.
Ultimately, simplifications and assumptions guide the models and heuristics we use to make relative and intrinsic valuations. This is very much true for the Gordon Growth Model described above as well. Hence, there is great value in understanding what drives our numbers, and where risk and uncertainty in our interpretations exist. This is important for main street investors that don’t have the time to build detailed DCF models for every company or account for every factor. A proper understanding of these drivers can prime us with a better intuition for the multiples we observe.
References
- Stannard-Stockton, S. (2016). ROIC vs Growth: What drives PE Ratios?. Intrinsic Investing. Available at < https://intrinsicinvesting.com/2016/09/01/roic-vs-growth-what-drives-pe-ratios/ >
- Priest, W., & Bleiberg, S. (2019). The P/E Ratio: A User’s Manual. Epoch Perspectives. Article available at <http://www.eipny.com/white-papers/the_p-e_ratio_a-users_manual/>
- Damodaran, A. The Stable Growth DDM: Gordon Growth Model. Stern School of Business. New York University. Lecture notes available at <http://people.stern.nyu.edu/adamodar/pdfiles/ddm.pdf>
- Damodaran, A. (2015). Cash, Debt and PE Ratios: Cash is an upper and debt is a downer! Available at <http://aswathdamodaran.blogspot.com/2015/06/debt-cash-and-pe-why-cash-is-upper-and.html>
- Damodaran, A. (2015). The Value and Pricing of Cash: Why low interest rates & large cash balances skew PE ratios. Available at <http://aswathdamodaran.blogspot.com/2015/05/valuing-pricing-cash.html>
- Chaddha, N., Rehm, W., & McNish, R. (2004). All P/Es Are Not Created Equal. McKinsey & Company. Article available at < https://www.mckinsey.com/business-functions/strategy-and-corporate-finance/our-insights/all-pes-are-not-created-equal>
- Mauboussin, M. (2014). Calculating Return on Invested Capital. Available at <https://plus.credit-suisse.com/rpc4/ravDocView?docid=P8BJ3Y>
Further reading
- Competition Demystified – Bruce Greenwald on competitive advantages
- Bruce Greenwald on Value Investing, From Graham to Buffett and Beyond
- Value: The Four Cornerstones of Finance – Koller, Dobbs and Huyett
- Conservative Investors Sleep Well – Philip Fisher on investment characteristics
- The Intelligent Investor — Benjamin Graham on fallibility, competition, and the margin of safety
- The mental models, routines, and checklists of Guy Spier and Aquamarine Capital
Recent posts
- Arguing with Zombies — Paul Krugman on Bad Models and False Idols
- Raghuram Rajan on Financial Development and the Making of a Riskier World
- The Winner’s Curse — Richard Thaler on the Anomalies of Auctions
- The Market for Lemons — George Akerlof on Asymmetry, Uncertainty and Information
- Reflexivity and Resonance — Beunza & Stark on Quantitative Models and Systemic Risk
- Power Laws — Mark Newman on Solar Flares, Gambling Ruins and Forest Fires
- Heresies of Finance — Benoit Mandelbrot on Volatile Volatility and Valueless Value
- Financial Instability Hypothesis — Hyman Minsky on Ponzi Finance and Speculative Regimes